About this dataset

This dataset is a dump of all posts sent on all mailing lists hosted at the Eclipse Forge. Although this is public data (the mailing lists can be browsed on the official mailman page) all data has been anonymised to prevent any misuse. The privacy issues identified, along with the anonymisation process, have been covered in a [dedicated document]({{< relref “datasets_privacy” >}}).

These files are published under the Creative Commons BY-Attribution-Share Alike 4.0 (International) licence.

The dataset is composed of two parts:

All of them are updated weekly at 2am on Sunday.

Privacy concerns

We value privacy and intend to make everything we can to prevent misuse of the dataset. If you think we failed somewhere in the process, please let XXX us know so we can do better.

All personally identifiable information has been scrambled using the data anonymiser Perl module. As a result there is no clear email address in this dataset, nor any UUID or name. However all identical information produces the same encrypted string, which means that one can still identify identical data without knowing what it actually is. As an example email addresses are split (name, company) and encoded separately, which enables one to e.g. identify posters from the same company without knowing the company.

The anonymisation technique used basically encrypts information and then throws away the private key. Please refer to the documentation published on github for more details.

About this document

This document is a R Markdown document and is composed of both text (like this one) and dynamically computed information (mostly in the sections below) executed on the data itself. This ensures that the documentation is always synchronised with the data, and serves as a test suite for the dataset.

Basic summary

Structure of data

This dataset is composed of a single big CSV file. Attributes are: list, messageid, subject, sent_at, sender_name, sender_addr.

Examples are provided at the end of this file to demonstrate how to use it in R.

list

Examples:
(#tab:list.sample)Sample of list names
Project list names
dtp-sqldevtools-dev
birt-charting-dev
platform-search-dev
iot-pmc
oneofour-dev

messageId

Examples:
(#tab:messageid.sample)Sample of message IDs
Message ID
DUvAYLFPILlVRvK8@M3ey1je9TZVHcRSk
jtPP4TGXqdU4QgxA@FEyh4USkFpVuSfb9
K1i6TawZwzUtmPey@CRddTcqAJPy1d2xd
jr+PiggwYqsxJk90@Q5fnXcfmtwrVLyoR
dwU+DgiU+eZofUfb@A9wgDekZVa6tZfgJ

Subject

Examples:
(#tab:subject.sample)Sample of email subjects
Subject
Re: [tycho-user] Install plugin could not write metadata error.
[jakarta.ee-community] Java LTS vs Future compatibility
[platform-releng-dev] [eclipse-build]Build N20090316-2000 (Timestamp: 200903162000):Automated JUnit testing complete. Test failures/errors occurred.
Re: [m2e-dev] m2e-wtp / pomproperties conflict
[birt-dev] Checkin: Fix Bugzilla #128566: Build Web Viewer compilation failed in daily build 20060220

Sent at

Main characteristics:

Examples:
(#tab:sentat.sample)Sample of sent dates
Sent date
2014-05-22 04:03:56
2013-04-07 08:00:14
2009-05-14 06:40:15
2013-03-24 13:28:03
2010-11-23 18:06:01

Sender name

Examples:
(#tab:sendername.sample)Sample of sender names
Sender names
TU5T7ZV88vyO7uLq
oDfF7b2a5J5km79c
AN0c++VfvrhiOLc+
ZVMlZM0fCELwRzDB
GGZ3+b+v5QirJoD8

Note: A single name repeated several times will always result in the same scrambled ID. This way it is possible to identify same-author posts without actually knowing the name of the sender.

Sender address

Examples:
(#tab:senderaddr.sample)Sample of sender addresses
Sender addresses
ZREFZCKMadxdtBKn@W1nN8AwAEVtafMpA
kDshJKq5xZZL27Pr@chCGqpnXMYAEJlyc
O9AyufnKG8aerT8Q@UR6pxDeRuFvVfSQJ
FJAwtWMPMYSjyJg3@LvaWf22tawg2RAtY
dYeGcUiNQyUUnJGW@RO/dtUxNFIJZUNdt

Note: A single email address repeated several times will always result in the same scrambled email address. Furthermore both parts of the email (name, company) are individually scrambled, which means that one can identify email addresses from the same company without actually knowing the real company or name of the sender.

Using the dataset

Reading CSV file

Reading file from eclipse_mls_full.csv.

project.csv <- read.csv(file.in, header=T)

We add a column for the Company, which we extract from the email address (i.e. the domain name):

project.csv$Company <- substr(x = project.csv$sender_addr, 18, 33)

Number of columns in this dataset:

ncol(project.csv)
## [1] 7

Number of entries in this dataset:

nrow(project.csv)
## [1] 676383

Names of columns:

names(project.csv)
## [1] "list"        "messageid"   "subject"     "sent_at"     "sender_name"
## [6] "sender_addr" "Company"

Using time series (xts)

The dataset needs to be converted to a xts object. We can use the sent_at attribute as a time index.

require(xts)
project.xts <- xts(x = project.csv, order.by = parse_iso_8601(project.csv$sent_at))

Plotting number of monthly posts

When considering the timeline of the dataset, it can be misleading when there several submissions on a short period of time, compared to sparse time ranges. We’ll use the apply.monthly function from xts to normalise the total number of monthly submissions.

project.monthly <- apply.monthly(x=project.xts$sent_at, FUN=nrow)

autoplot(project.monthly, geom='line') + 
  theme_minimal() + ylab("Number of posts") + xlab("Time") + ggtitle("Number of monthly posts")

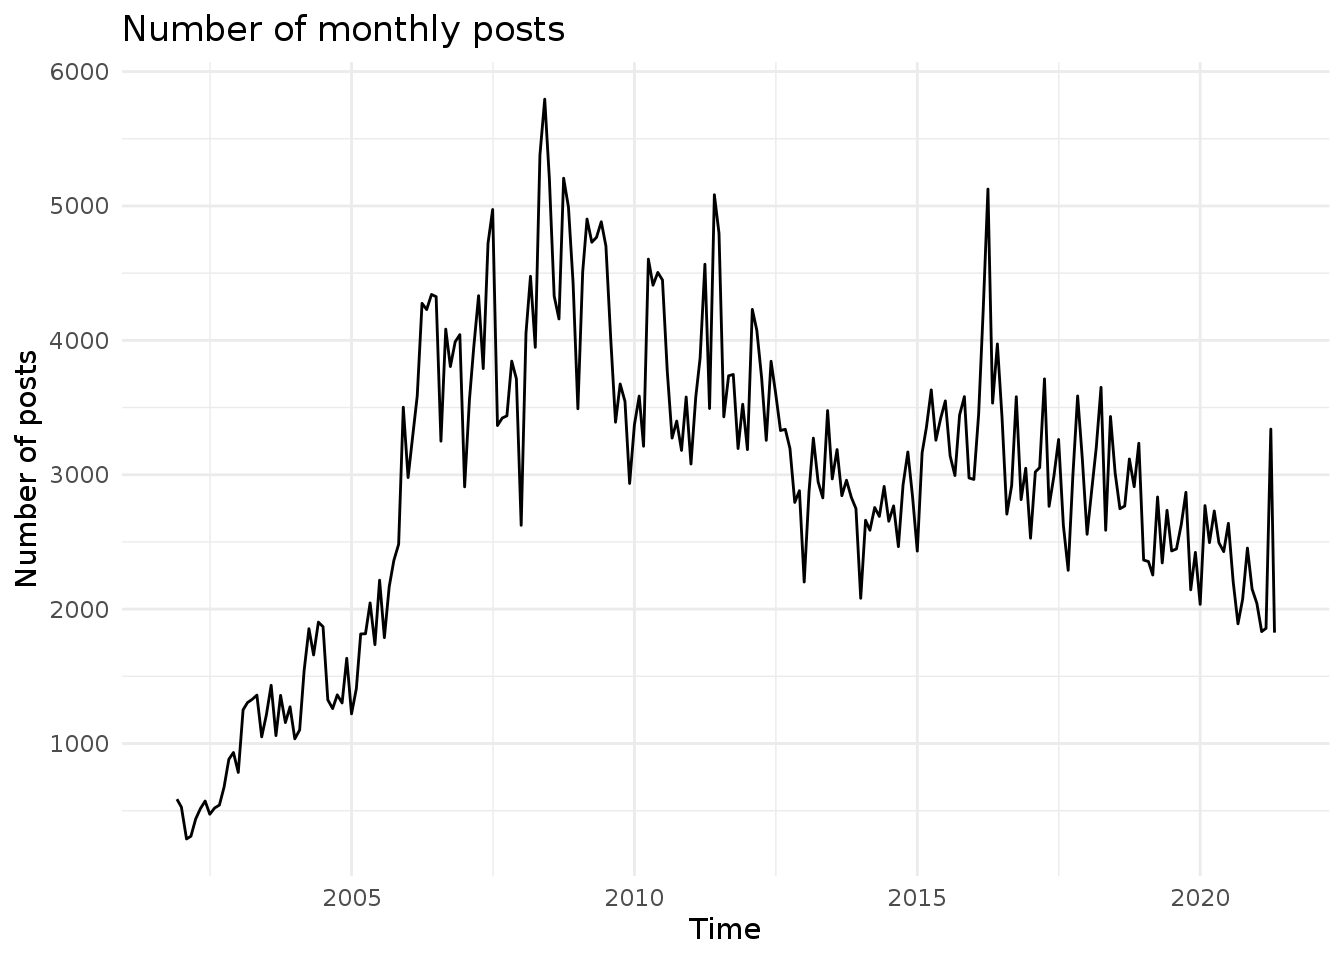
Plotting number of monthly reporters

One author can post several emails on the mailing list. Let’s plot the monthly number of distinct authors on the mailing list. For this we need to count the number of unique occurrences of the email address (attribute sender_attr).

count_unique <- function(x) { length(unique(x)) }
project.monthly <- apply.monthly(x=project.xts$sender_addr, FUN=count_unique)

autoplot(project.monthly, geom='line') + 
  theme_minimal() + ylab("Number of authors") + xlab("Time") + ggtitle("Number of monthly distinct authors")
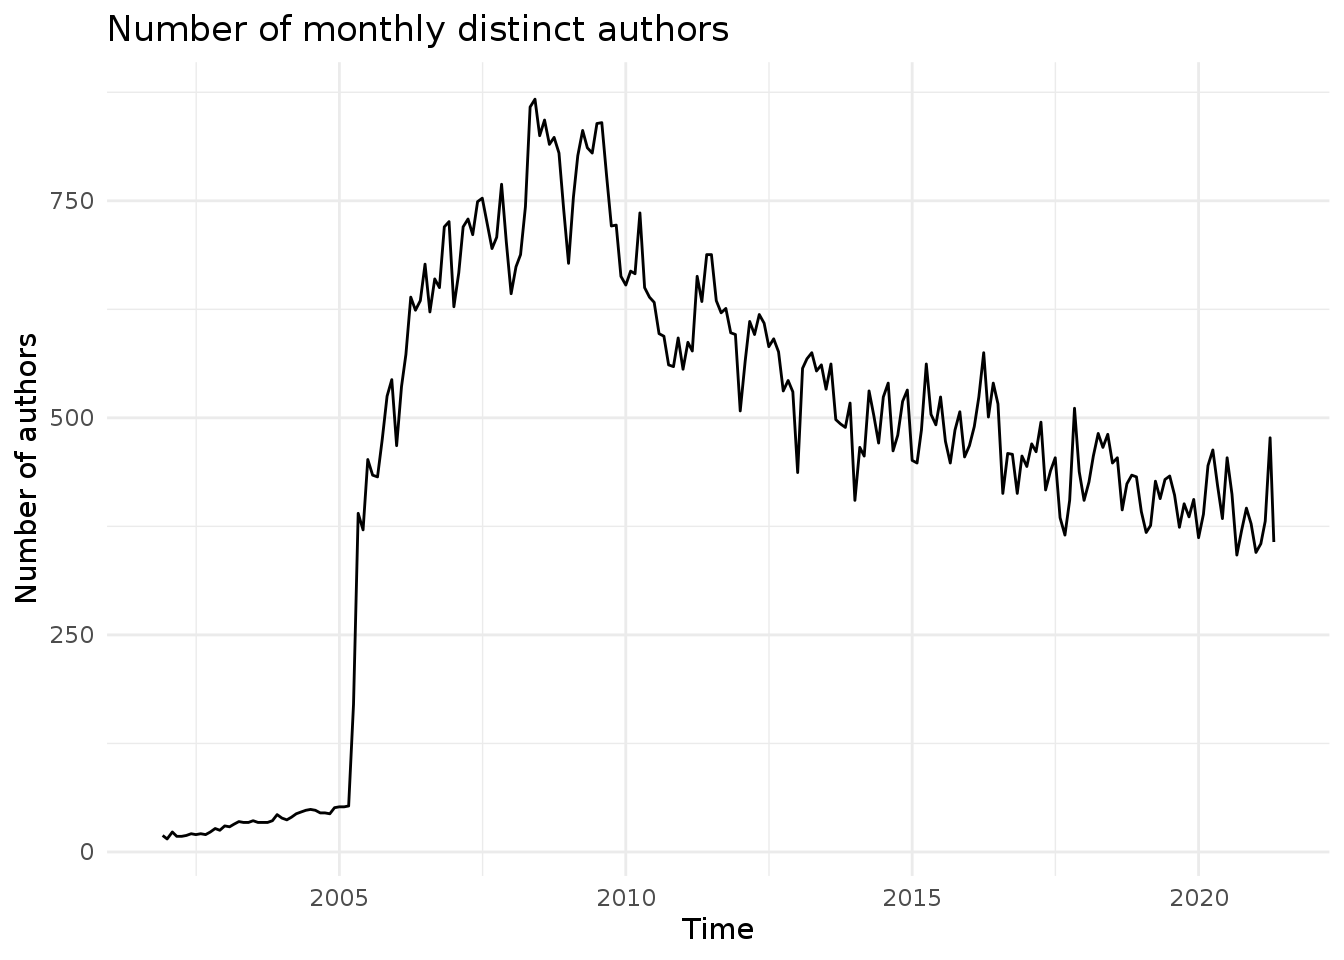
Plotting activity of authors

We want to plot the number of emails sent by each author regardless of the mailing list they were sent on. We display only the 10 top posters:

(#tab:reporters.sample)Top 10 senders on mailing lists
Sender address Number of posts Company
VHhV5lx01jAWyAeI@W1nN8AwAEVtafMpA 37998 W1nN8AwAEVtafMpA
bRO6C3dLsSwEqKIR@W1nN8AwAEVtafMpA 19739 W1nN8AwAEVtafMpA
ZQcbyzPlXigufV0c@W1nN8AwAEVtafMpA 15720 W1nN8AwAEVtafMpA
QV3kc9zbTtjEc/4h@W1nN8AwAEVtafMpA 9696 W1nN8AwAEVtafMpA
bfZnzraFE3tzUecD@W1nN8AwAEVtafMpA 8828 W1nN8AwAEVtafMpA
YbTJiaC/2iJfj5S+@Eg1Eg8ah5Rcf8CJw 8428 Eg1Eg8ah5Rcf8CJw
Tr6NBL4ey/ypIq/L@W1nN8AwAEVtafMpA 6969 W1nN8AwAEVtafMpA
jhlkGo7m10rWJX3r@W1nN8AwAEVtafMpA 5327 W1nN8AwAEVtafMpA
VUAPm0goc1TOKubf@W1nN8AwAEVtafMpA 5012 W1nN8AwAEVtafMpA
RPKB7RxAMI1rlIZh@b0LdzEWMDBXUKPTF 4945 b0LdzEWMDBXUKPTF

Now plot these 50 top posters with ggplot and use the company (i.e. second part of the email address) for the colour:

authors.subset <- head( authors, n = n)

authors.subset.df <- as.data.frame(authors.subset)
names(authors.subset.df) <- c('ID', 'Posts')
authors.subset.df$Author <- substr(x = authors.subset.df$ID, 1, 16)
authors.subset.df$Company <- substr(x = authors.subset.df$ID, 18, 33)

p <- ggplot(data=authors.subset.df, aes(x=reorder(Author, -Posts), y = Posts, fill = Company)) + 
  geom_bar(stat="identity") + 
  theme_minimal() + ylab("Number of posts") + xlab('Posters') + 
  ggtitle(paste(n, " overall top posters on Eclipse mailing lists", sep="")) +
  theme( axis.text.x = element_text(angle=60, size = 7, hjust = 1))
g <- ggplotly(p)
g
#api_create(g, filename = "r-eclipse_mls_authors")

Posts by Company

We want to know what companies posted the most messages in mailing listsacross years. To that end we select the 20 companies that have the larger number of posts and plot the number of messages by company year after year.

comps_list <- head( sort( x = table(project.csv$Company), decreasing = T ), n=20 )
df <- data.frame(Company=character(), 
                 Year=character(),
                 Posts=integer(), 
                 stringsAsFactors=FALSE) 
for (i in seq_along(1:20)) {
  project.comp.xts <- project.xts[project.xts$Company == names(comps_list)[[i]],]
  project.comp.yearly <- apply.yearly(x=project.comp.xts$Company, FUN=nrow)
  for (j in seq_along(1:nrow(project.comp.yearly))) {
    year <- format(index(project.comp.yearly)[[j]],"%Y")
    comp <- as.data.frame(t(c(names(comps_list)[[i]], year, as.integer(project.comp.yearly[[j]]))))
    names(comp) <- c("Company", "Year", "Posts")
    df <- rbind(df, comp)
  }
}

df$Company <- as.character(df$Company)
df <- df[order(df$Company),]

p <- ggplot(data=df, aes(x=Year, y = Posts, fill = Company)) + geom_bar(stat="identity") + 
  theme_minimal() + ylab("Number of posts") + xlab('Years') + 
  ggtitle("Top 20 Companies involved in Eclipse mailing lists across years") +
  theme( axis.text.x = element_text(angle=60, size = 7, hjust = 1))

g <- ggplotly(p)
g
#api_create(g, filename = "r-eclipse_mls_companies")